Below are some R console pictures from some work I have being doing with my five years for Google data location history. I have looked for other open source routines that analyze this type of data with rdata.table but had no luck. I have placed my code here: https://github.com/rferrisx/Surveillance_Capitalism. Code development is ongoing.
I am bit gob-smacked at the frequency and accuracy of Google's geo-location data logging. But on a technical level, I don't know why I should be. There is a lot of discussion about this regarding law enforcement, intelligence community and commercial use of this data. (There is also a simultaneous discussion of hacked cellular routing protocols like ss7.) I am still trying to decide if this is good or bad or just the world as it is now and will be forevermore. For now, "comprehensive" is my best description of Google's location data. Click to enlarge charts and screenshots. Plotting your positions on Google Earth Pro requires the aggregation or subsetting appropriate to a 2500 lat/lon position limit.
R, Julia, SQL, Octave and others: Personal notes on data analysis, computation, data access most especially for querying voter history, Census, PDC, and other election data. Reader is advised to just paste the code text into Notepad++.
Sunday, September 29, 2019
Thursday, August 15, 2019
Thursday, August 8, 2019
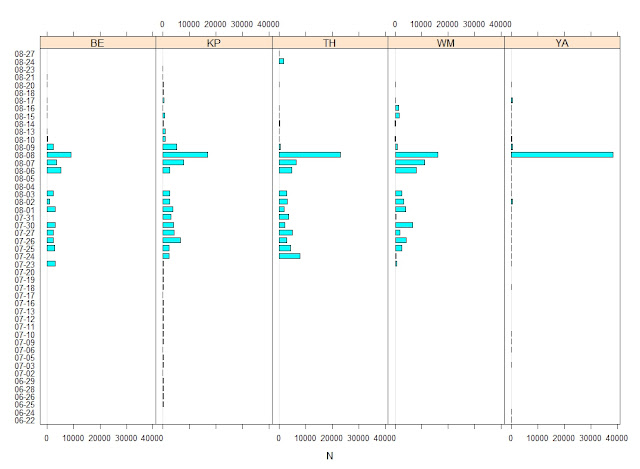
Ballot Returns by Status Date for 2018 Primary for BE,KP,TH,WM,YA
Election date for the charts below is 08/07/2018. In the "stampless ballot" era, the largest returns are often the day after the election. Drop boxes are probably fully collected but certainly locked by 8PM on election day. Mail in ballots sent Monday and Tuesday flow to postal collection centers (e.g. Seattle), receive a postmark in the evening and return the next day or the day after as mail is not necessarily delivered to County Elections offices on Tuesday. County election departments can 'process and then tabulate' a fixed amount each day at given labor/machine capacities. Thus, two days after the election is over, some counties are still processing ballots that are part of classical election returns and not part of certification period "curing" of previously rejected (e.g. challenged) ballots. Click to enlarge charts.
 |
| 2018 Primary Ballot Returns by StatusDate for BE, KP, TH, WM, YA. Election Date was 08/07/2018. |
 |
| 2018 Primary Return Data came from multiple voting systems. Click to Enlarge. |
Saturday, July 27, 2019
Some PDC Contribution queries: Lovelett vs Blackwood 40th LD as of July 27 2019
Some (limited) PDC Contribution queries: Lovelett vs Blackwood 40th LD as of July 27 2019 . Data from https://data.wa.gov/Politics/Contributions-to-Candidates-and-Political-Committe/kv7h-kjye below the break. These numbers can change quickly with new reporting. Make sure to understand how I have limited the queries. -RMF
Sunday, July 14, 2019
Divining come and gone voters from two different data slices four months apart
# Divining come and gone voters from two different data slices four months apart
# Set proper paths for your data and data sets
# fread chokes on too many columns thus a workaround with rbind
# RMF 07/14/2019
# This is designed to be memory efficient non SQL
library(data.table)
library(lubridate)
library(lattice)
# Set proper paths for your data and data sets
# fread chokes on too many columns thus a workaround with rbind
# RMF 07/14/2019
# This is designed to be memory efficient non SQL
library(data.table)
library(lubridate)
library(lattice)
Saturday, March 2, 2019
FRBs: DM and width Density Plots
Chart 1 : FRBs DM sorted ascending.
Chart 2 :Density plots for all DM and DM <= 1300
Chart 3: Density by group for DM
Chart 4: Density by group for width < 25
Chart 5: Density by group for width > 25
Source Paper: http://adsabs.harvard.edu/abs/2016PASA...33...45P
(For further citation information see below.)
data source : http://www.frbcat.org/ using 08.20.2019 data
Click to enlarge charts.